British Pies: Pastry, Filling and Total Composition
Comprehensive analysis of traditional pub pie dishes.
Comprehensive analysis of traditional pub pie dishes.
Pies represent a substantial category of British pub cuisine, featuring pastry exteriors enclosing meat, vegetable, and gravy-based fillings. The pastry component forms a critical determinant of overall nutritional profile, as traditional shortcrust pastry incorporates significant quantities of fat and refined flour.
Traditional shortcrust pastry comprises flour, fat (typically butter or lard), salt, and water. The fat content is essential for achieving the characteristic texture and flavour, but contributes substantially to energy density.
| Pastry Type | Per 100g (kcal) | Fat (g) | Carbohydrates (g) |
|---|---|---|---|
| Plain flour (uncooked) | 364 | 1.3 | 76 |
| Shortcrust pastry (baked) | 530 | 30 | 53 |
| Puff pastry (baked) | 548 | 34 | 48 |
The fat content in pastry ranges from 25-40% of composition by weight, resulting in energy density substantially exceeding flour alone. A typical pie pastry crust weighing 100-150g contains 260-300 kcal derived predominantly from fat.
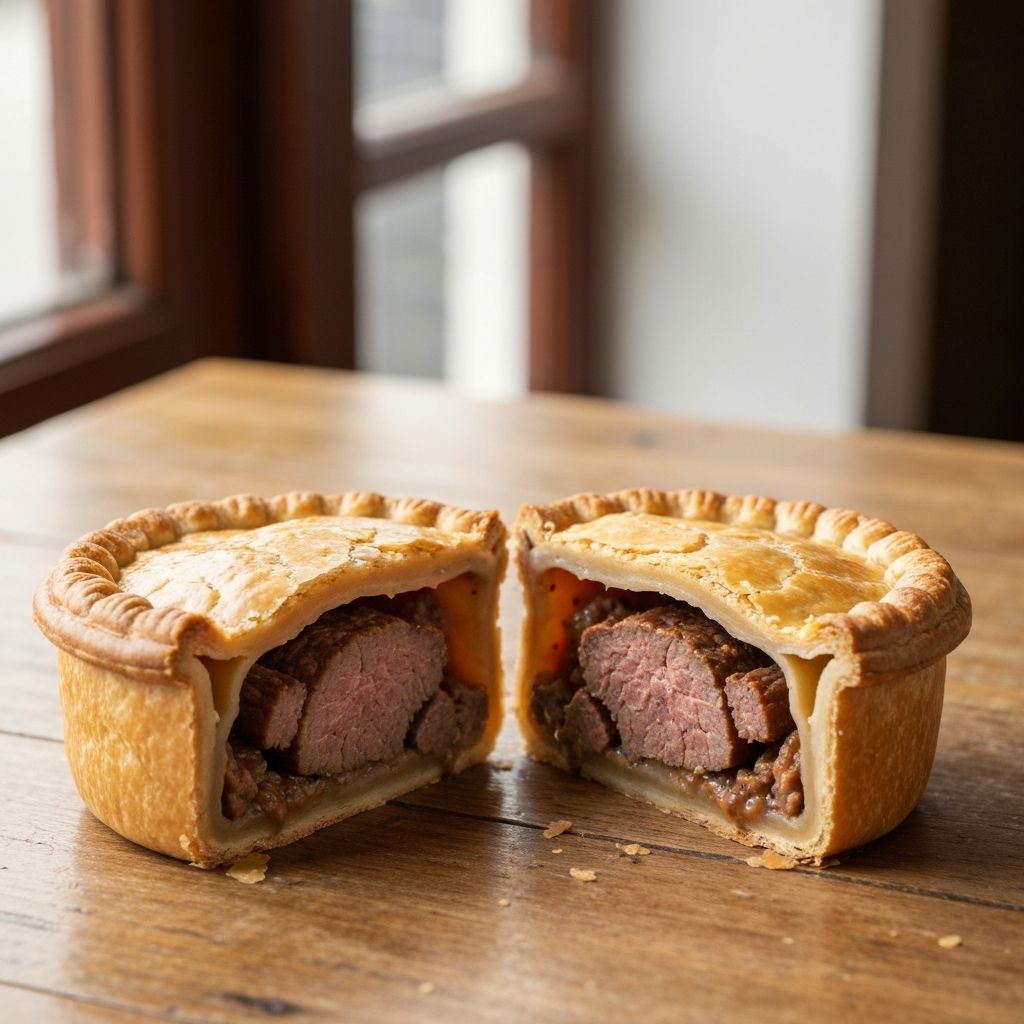
The most prevalent traditional pub pie, steak & ale pie comprises chunks of beef, typically stewing beef containing moderate fat, enclosed in pastry with gravy-based sauce.
| Component | Per 100g (kcal) | Typical Serving (kcal) | Protein (g) |
|---|---|---|---|
| Stewing beef (cooked) | 180 | 225 | 28 |
| Ale-based gravy | 25 | 75 | 1.2 |
| Onions (cooked) | 30 | 45 | 0.6 |
A lighter alternative to beef pie, though cream-based rather than broth-based sauces are common, offsetting potential energy density reduction.
| Component | Per 100g (kcal) | Typical Serving (kcal) | Fat (g) |
|---|---|---|---|
| Chicken breast (cooked) | 165 | 198 | 7 |
| Mushrooms (cooked) | 35 | 52 | 0.4 |
| Cream sauce | 80 | 120 | 9 |
The Cornish pasty represents a distinct category of British pie, characterised by a crimped pastry edge and traditional beef, potato, and vegetable filling.
| Component | Per 100g (kcal) | Typical Pasty (g) | Total Calories |
|---|---|---|---|
| Pastry crust | 530 | 120 | 636 |
| Beef filling | 180 | 150 | 270 |
| Potato & vegetable | 50 | 150 | 75 |
Typical pub pie servings comprise the following complete compositions:
| Pie Type | Total Weight (g) | Total Calories | Fat (g) | Protein (g) | Carbs (g) |
|---|---|---|---|---|---|
| Steak & Ale | 400 | 720 | 32 | 42 | 56 |
| Chicken & Mushroom | 380 | 660 | 30 | 38 | 52 |
| Cornish Pasty | 550 | 980 | 44 | 52 | 78 |
The energy density of pies (per gram) averages 1.6-1.8 kcal/g, placing them within the moderate-to-high energy density range. However, portion sizes are often substantial, resulting in considerable total energy intake per serving.
The pastry component contributes disproportionately to energy density. A pie with identical filling weight would contain significantly fewer calories if prepared as a stew without pastry crust.
British pub pies typically contain high sodium content, with values ranging from 450-700mg per serving, representing 19-30% of recommended daily intake.
The beef-based fillings provide iron, zinc, and B vitamins, whilst vegetable components contribute limited micronutrient density due to cooking methods and portion proportions.
Variations in preparation significantly influence nutritional composition:
British pies emerged as a practical preparation method for extending meat supplies through combination with vegetables and gravy-based sauces. The pastry crust served both practical (sealing filling) and cultural significance. Whilst refrigeration has rendered this preservation function obsolete, pie consumption remains culturally prominent within British pub settings.
This information serves an educational purpose regarding the nutritional composition of traditional British pub meals.
Explore pub meal composition